Features

Start with the essentials

See your assets and today’s calls first. Open detailed analysis when you need it.

Easy

11screens

What your money is doing, and what to do today. In words anyone can read on the first try.

Expert

21screens

Open up where each call came from. The indicator network, correlation tables, the response matrix, the model's training state.

Screen list

Which view do you want?

Press a button. The names change the same way inside the program.

Easy mode. Expert-only screens are shown dimmed. They are actually folded away, and you can open them anytime.

Status

3 screens · all 3 shown in Easy mode

What state your money is in right now.

Calls

4 screens · all 4 shown in Easy mode

What's worth buying or selling today, and why.

Indicators & correlation

5 screens · none shown in Easy mode

The basis those calls rest on. See for yourself how the indicators are tied together.

Deep analysis

3 screens · none shown in Easy mode

Digs into financials, institutional activity, even the model's training.

Operations

3 screens · 1 shown in Easy mode

Whether data is coming in properly, whether it's secure, and how your limits are set.

Help

1 screen · shown in Easy mode

Look here whenever you hit a term you don't know.

Indicators inside

2,793 indicators,
read in 31 groups

From positioning, news and sentiment that measure what people feel, to rates, FX and earnings. Each indicator is used only after it was published, and the links between them are recomputed every day.

The counts come from the engine that is running right now. Bars show the number per group.

  • Positioning540
  • News347
  • Sentiment338
  • Social255
  • Single stocks231
  • Volatility207
  • Macro189
  • Prediction markets69
  • Rates65
  • Calendar50
  • Equity indices42
  • Policy40
  • Real estate39
  • Attention38
  • Shipping & supply38
  • Trade35
  • Fundamentals34
  • FX27
  • Energy25
  • Flows25
  • Sectors25
  • Speeches22
  • Corporate events16
  • Crypto15
  • Physical15
  • Geopolitics14
  • Metals14
  • Agriculture13
  • Liquidity12
  • Credit11
  • Breadth2

Data sources

40 sources,
collected around the clock

Public statistics, central banks, exchange quotes, filings, news and prediction markets. The engine judges for itself whether each source arrived within its usual rhythm; right now 33 are on time.

Green means on time, orange means the source itself is late. The number is how many indicators come from that source.

  • NEWS_RSSNews RSS670
  • YFYahoo Finance quotes373
  • INTRADAYIntraday quotes371
  • DATA_GO_KRKorea public data portal209
  • SEC13FSEC 13F holdings138
  • BISBank for International Settlements91
  • WORLDBANKWorld Bank73
  • FREDFederal Reserve economic data72
  • KALSHIPrediction markets (Kalshi)69
  • CFTCCFTC futures positions61
  • WIKIWikipedia page views38
  • GDELTGlobal news events (GDELT)36
  • PORTWATCHIMF PortWatch shipping33
  • ECOSBank of Korea statistics31
  • REPORTSBroker research27
  • FINMINDTaiwan market data24
  • CBOECboe20
  • EPUEconomic policy uncertainty18
  • TICUS Treasury international capital17
  • KCS_NEWSKorean news15
  • FEDREGUS Federal Register12
  • EIAUS Energy Information Administration10
  • EDGARSEC EDGAR filings10
  • USGSUS Geological Survey10
  • OFRUS Office of Financial Research9
  • OFACUS sanctions list8
  • NYFEDNew York Fed6
  • MOF_JPJapan Ministry of Finance6
  • DARTKorea DART filings6
  • COINGECKOCoinGecko5
  • GLDGold ETF holdings4
  • NHCUS National Hurricane Center4
  • UPBITUpbit quotes4
  • GPRGeopolitical risk index3
  • ONSUK Office for National Statistics3
  • INDEEDJob postings (Indeed)2
  • EUROSTATEurostat2
  • TSAUS airport passengers (TSA)2
  • NOAAUS NOAA1
  • WHOWorld Health Organization1

Real screens

What it looks like running

Real screens from the running program. Only the amounts are hidden. It is a personal account.

Easy
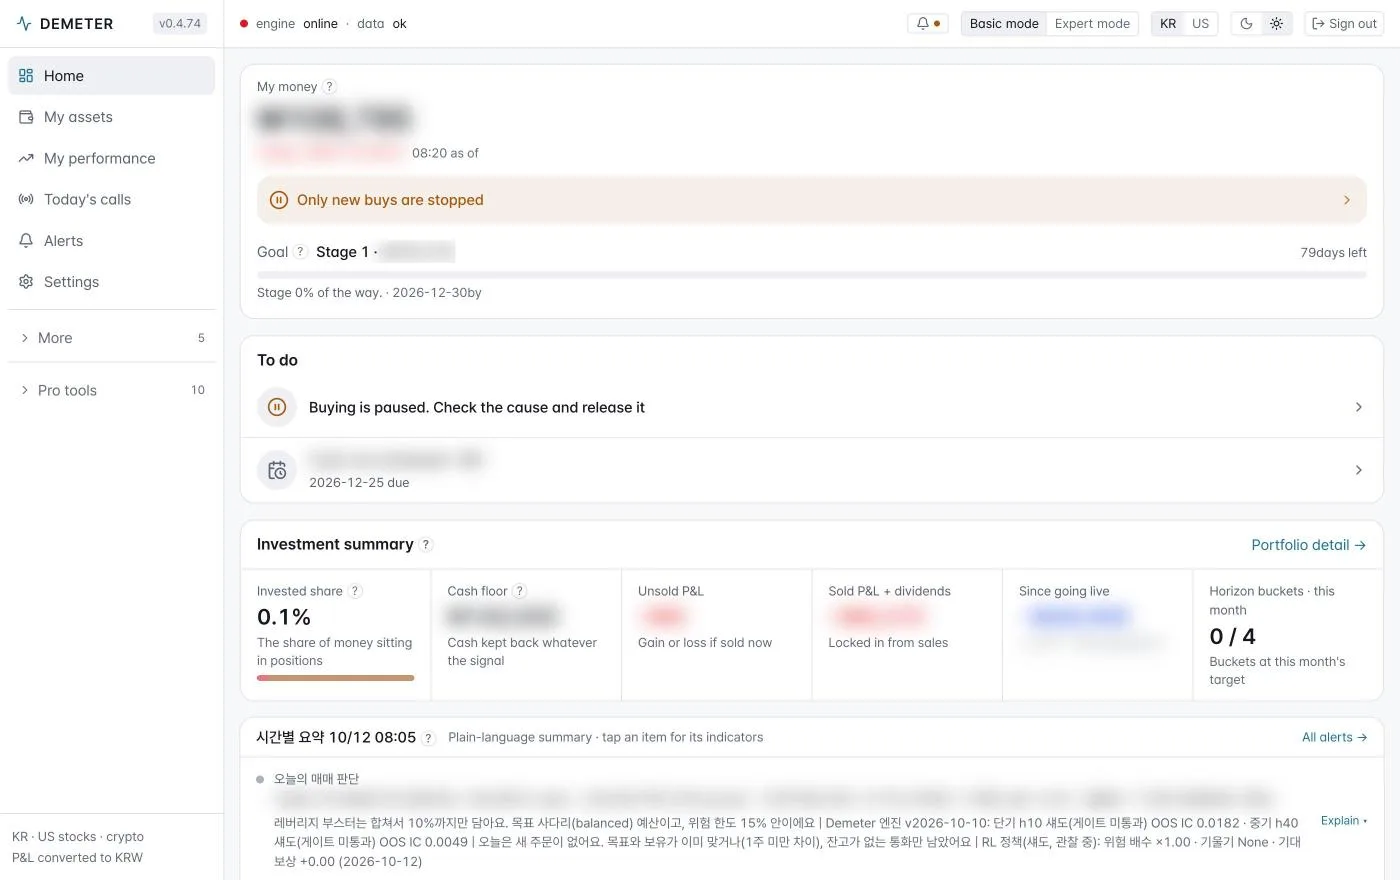
Demeter Today at a glance screen — assets, whether things look normal, and today's to-do list on one screen
Today at a glanceHow much you have, whether things look normal, and what's on your to-do list, all on one screen
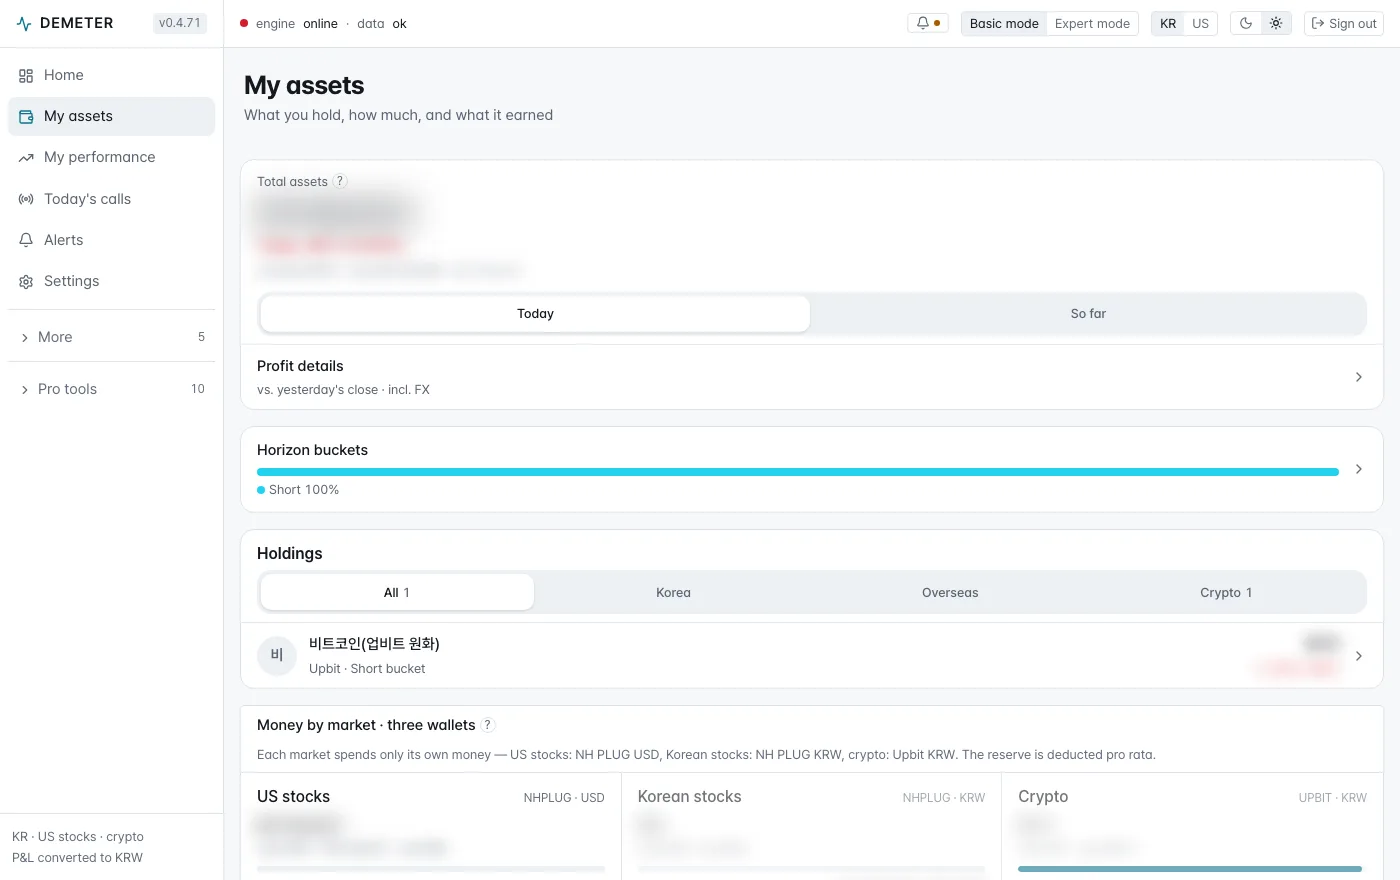
Demeter My assets screen — holdings, amounts and each goal-based bucket's distance from target
My assetsWhat you hold, how much, and how far each goal-based bucket is from its target
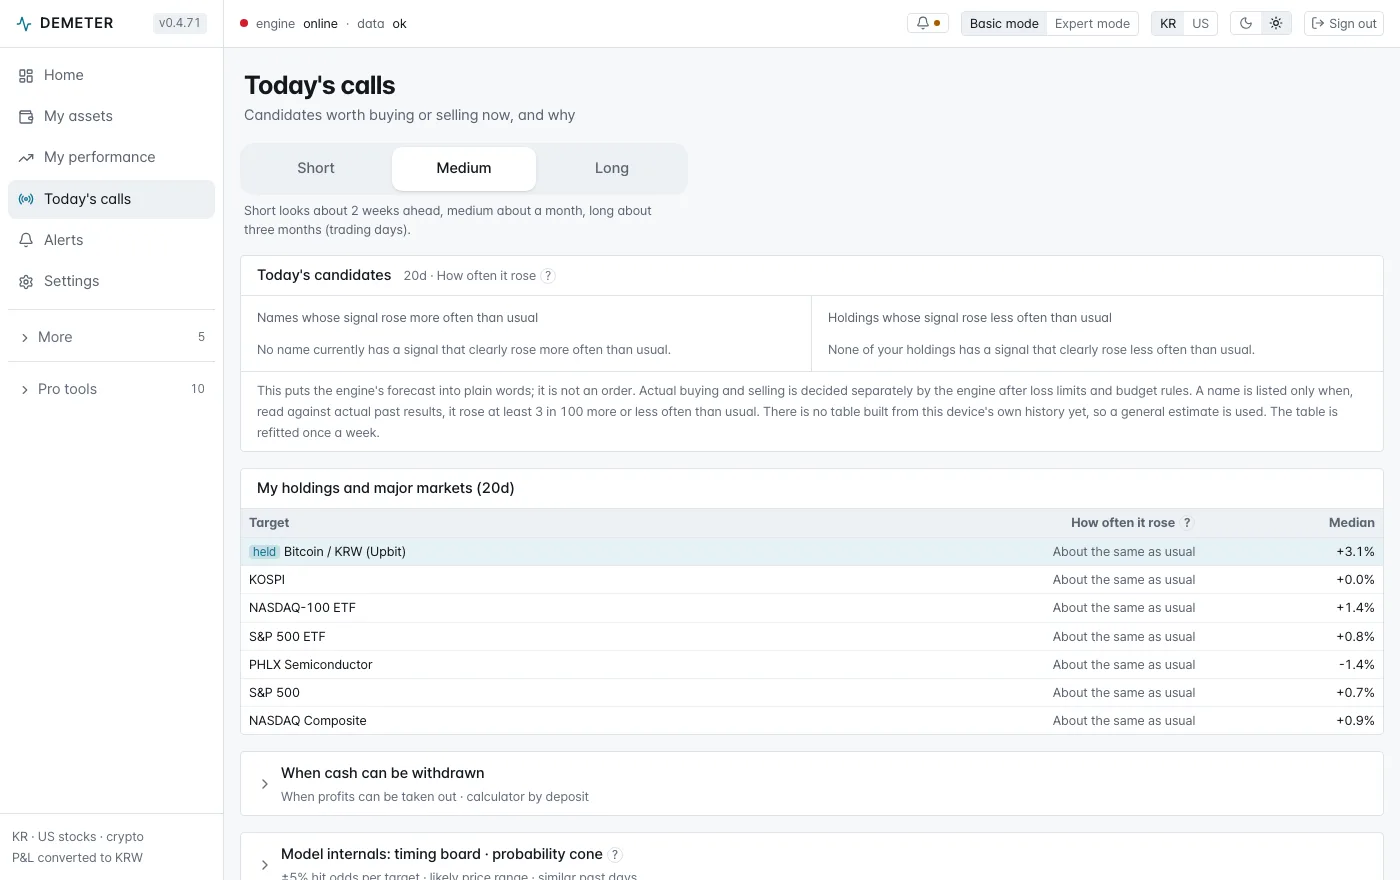
Demeter Today's call screen — buy and sell candidates for today with the reasoning behind each
Today's callToday's buy/sell candidates and the reasoning behind them
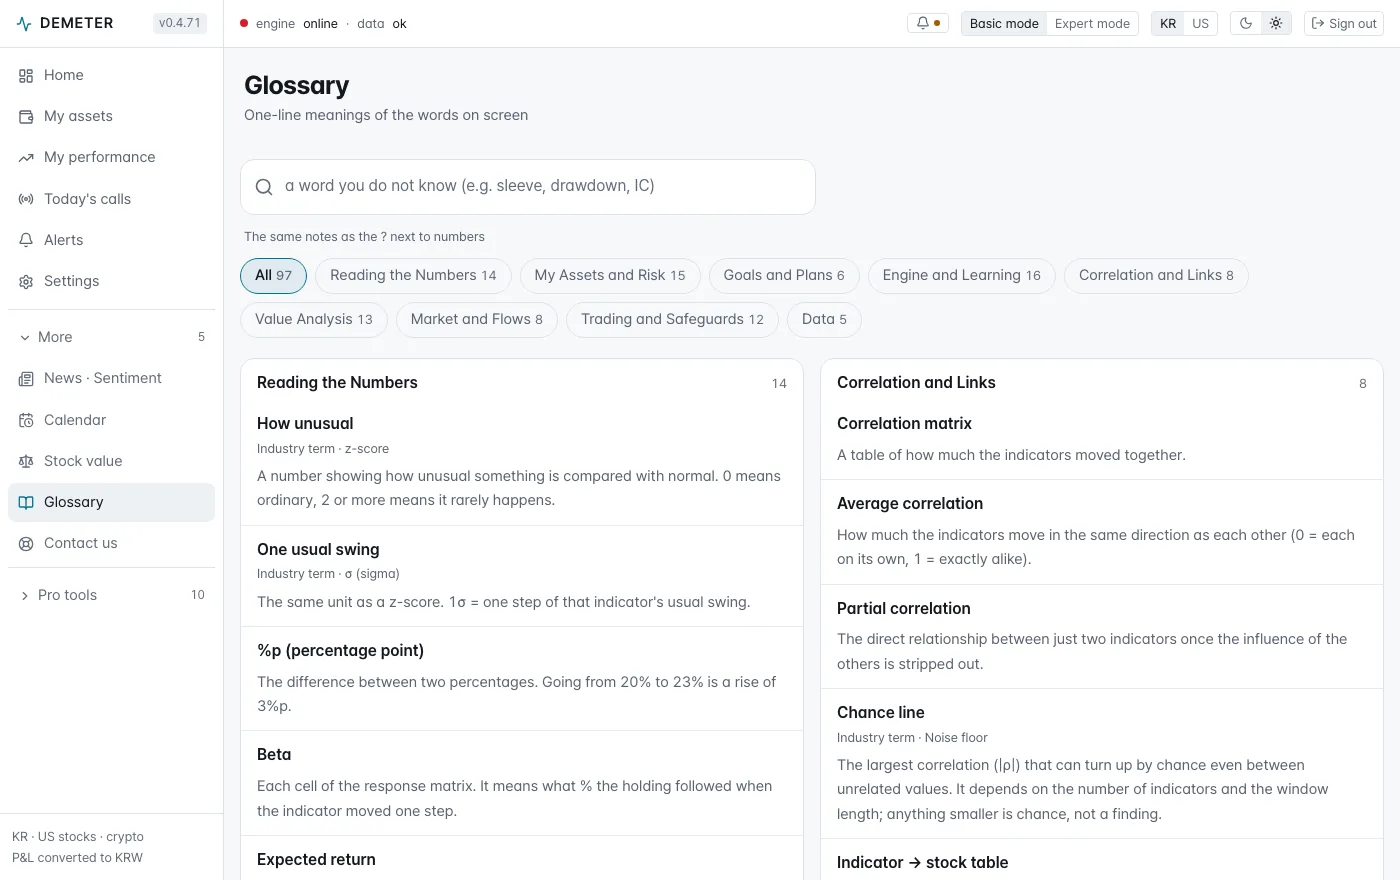
Demeter Glossary screen — one-line definitions of the terms used in the app
GlossaryEvery term you see on screen, explained in one line
Expert
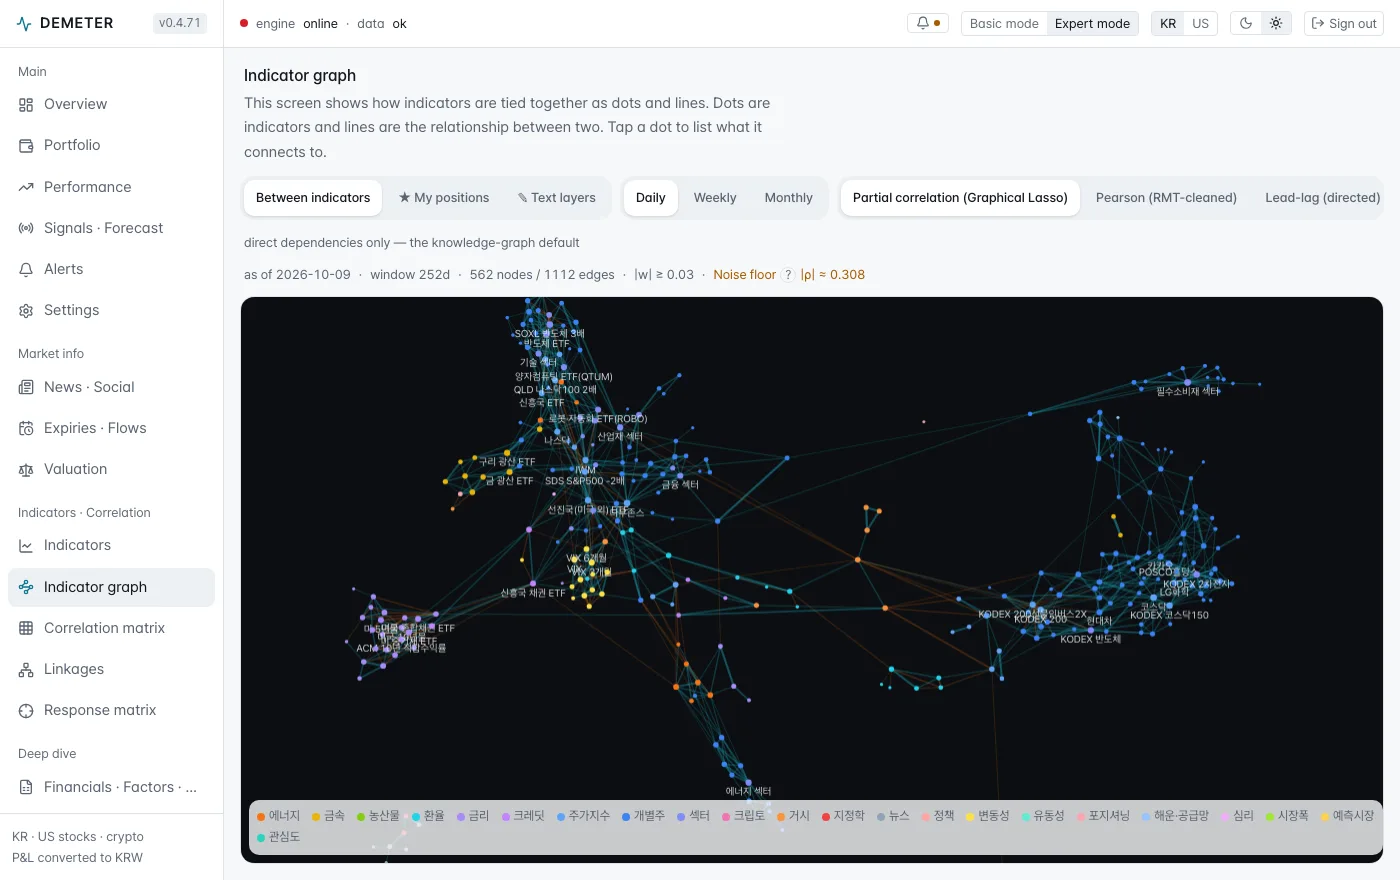
Demeter Indicator network screen — graph of indicator links left after third-cause links are removed, 562 nodes
Indicator networkHow indicators are linked to one another: only the links left standing once a third cause is ruled out (562 nodes shown here)
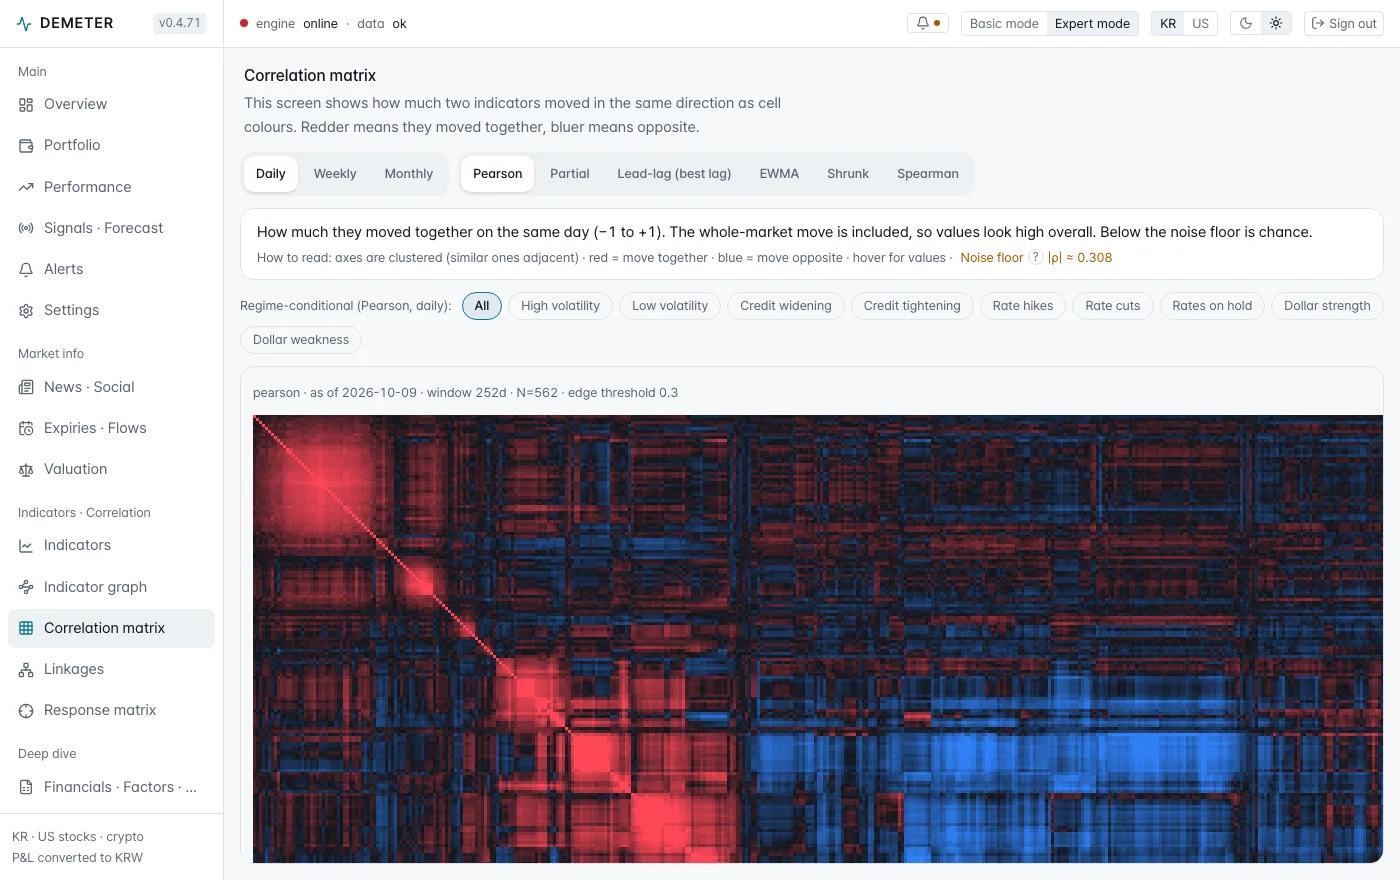
Demeter Correlation table screen — how closely indicators moved together, daily, weekly and monthly layers
Correlation tableHow closely indicators have moved together, as a table, with daily, weekly and monthly layers kept separate
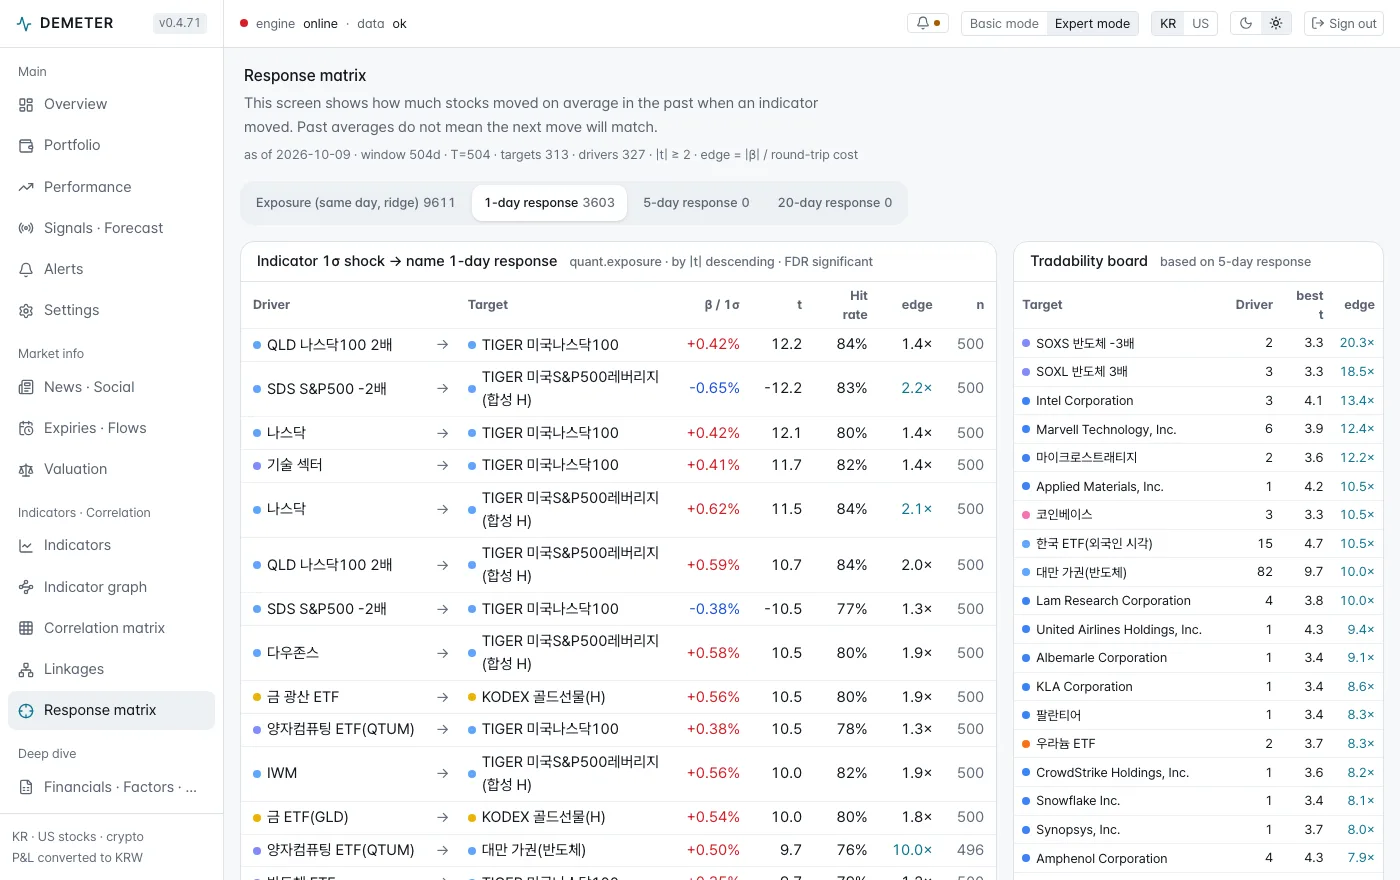
Demeter Exposure matrix screen — historical average stock move when an indicator moved
Exposure matrixThe historical average of how a stock moved when the indicator moved
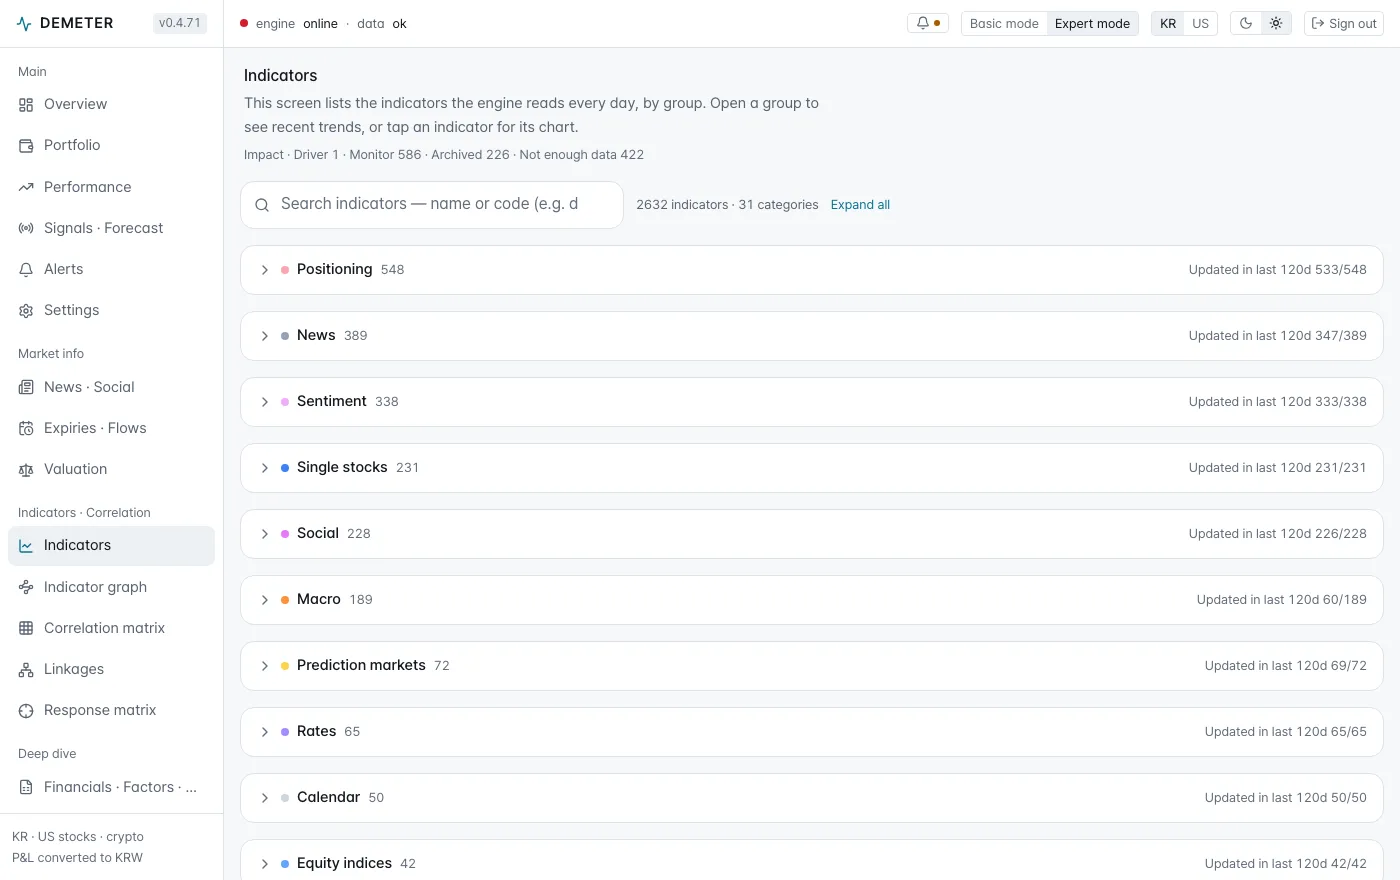
Demeter Indicator list screen — every tracked indicator with its trend and rating
Indicator listEvery indicator being tracked, and its rating

What this program is

What matters more than the screen count

You can still tell why it bought, months later

  • Every call comes with its reason. No screen ever just tells you to buy.
  • Why it bought or sold is kept in one line. In plain words, like "short-term entry."
  • Only validated strategies move your money. The rest stay on screen.
  • Any term you don't know is one click away in the glossary.

The money and the keys stay in your hands

  • Your account keys never leave this computer. Not even the seller can see them.
  • You set the limits. Order cap, daily loss limit, the cash you never touch.
  • If something looks off, only buying stops. Selling and stop-losses keep running.
  • No order the engine did not create goes out. Tampering inside the program is refused.

How the engine decides, written down

Collection, link computation, the eight validation gates, orders and protection, and learning, explained in plain words next to the technical terms.

See the engine page

FAQ

Questions about the screens

Easy and Expert mode and how the screens work, all in one place.

Screens and daily use See the questions

AI features

Reading, choosing and protecting,
all in one program

The reasoning always stays on screen. These are real screens from the maker's own account, with only the amounts hidden.

Today's call

Every buy comes
with its reasons

Candidates worth buying or selling now, with the evidence behind them. The probability of a rise and the expected range are written as numbers, and every trade keeps a one-line reason.

See every screen
Today's call screen

Indicator graph

How 2,793 indicators connect,
redrawn every day

Only the links that survive after third causes are removed. A person watches five indicators; the AI puts all 2,793 on the table and recomputes daily. On an unclear day it buys nothing.

See every screen
Indicator graph screen

Indicator to stock response

Which stocks follow
when an indicator moves

The past average of how each stock followed an indicator move, as a table. Every 5 minutes it reads how linked indicators react and applies it in whichever market is open.

See every screen
Indicator to stock response screen

Engine learning

It corrects its calls from fills
and keeps learning

It keeps only the indicators that work and grades them. Fill outcomes feed back into the calls, and the shared model trained on the brain server is downloaded into your program. You can see what it learned and how often it is right.

See every screen
Indicator list screen